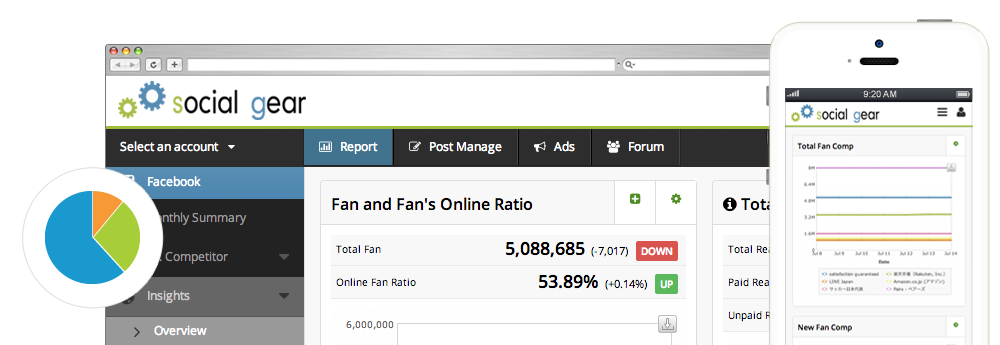
Reports
Audience Engagement
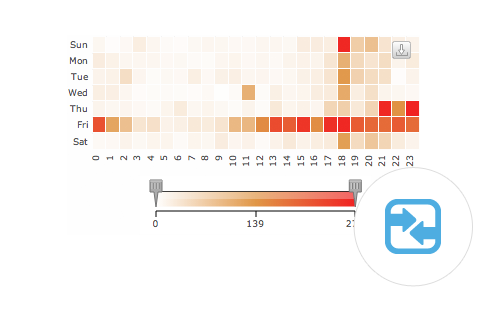
4 heat charts reveal hourly data of Like! aganst the page, Like! Comments and Shared against posts. Heat chart is equiped with the range limit feature to show values in the specific value range. You can also download the data in csv format.
Starting with "Page Engagements" chart, which is sum of "New Fan" and "Recommended Post Time", the heat charts consists of 4 chrats: "Recommended Post Time", which doesn't acount increment and decrement against new posts, "Engagements to Posts", which counts all posts, and "New Fan", which counts Like! against the page.
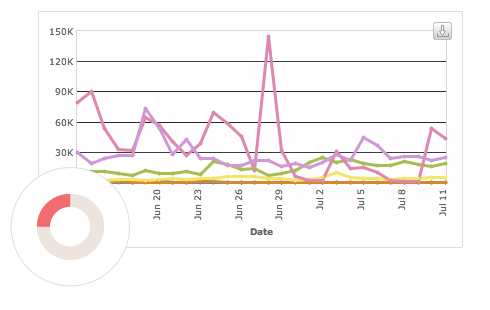
Powerful Graph
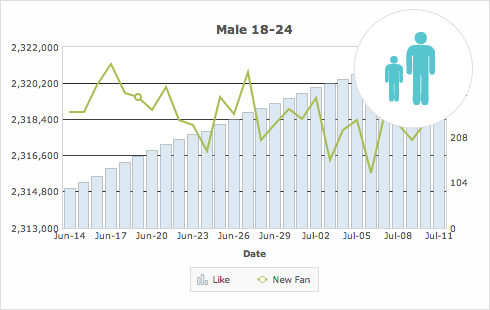
One graph shows the value transition of Daily, Weekly and 28days Value. It displays Weekly Value in every 7 days (a week). Each value can be hidden and displayed.
By being clicked on the line, the graph shows the list of posts which have been posted within the Value Range. From the list, you can analyze the each post and posts as a group. You can easily check the posts in the period where a giant value shift occured
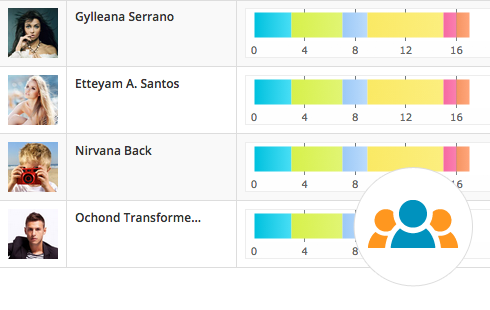
Active Fan
You can find who has reacted how on your facebook page contents most within the period. When they have commented on your posts, you can check the comments.
You can check those by Page Post and by User Posts, also by Gender. Those data can be exported in csv format.
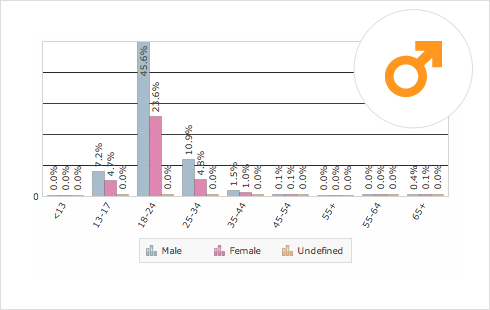
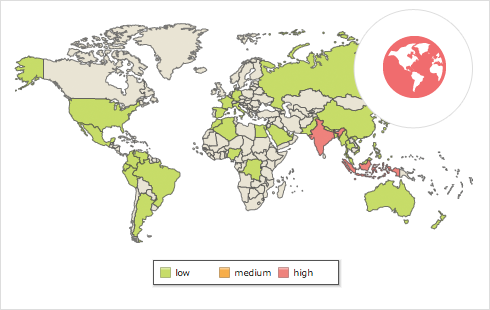
Demographics
You can not only check all demographic data in point of Reach, Engaged Users and Fan, but also compare each demographic among Reach, Enaged Users and Fan.
Each graph in Demographics shows the value, its share and the transition of the values. For example, you can easily compare the value transitions of the reach and engaged users who are 35~45 old male.
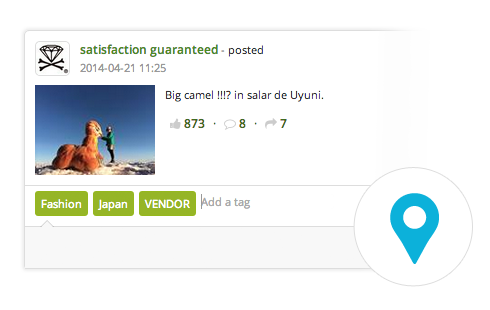
Tagging
You can tag any keyword against the posts. No limitation in number. A post regarding to a product can be promtion, review, type, grade and price. Tag them all and analyze them tag by tag.
A Dialogue of Post Overview reveals the situation of grouped posts. You can analyze posts by day of a week, posted time, type and message length. You can also see the average value of the grouped posts. It also provides the ranking table among the grouped posts.